Original Article
María Cristina Di Gioia1*, Paloma Gallar Ruiz1, Gabriela Cobo 1, Fernando García López2, José Luis Agud Aparicio3, Aniana Oliet1, Isabel Rodríguez1, Olimpia Ortega1, Rosa Camacho1, Juan Carlos Herrero1, Carmen Mon1, Milagros Ortiz1, and Ana Vigil1
1Hospital Severo Ochoa, Nephrology, Leganés, Madrid
2Instituto de Salud Carlos III, Madrid
3Hospital Severo Ochoa, Internal Medicine. Leganés, Madrid
Corresponding author
María Cristina Di Gioia, Hospital Severo Ochoa, Av. Orellana s/n 28911. Leganés, Madrid, Spain, Tel: 34-914818 000; Fax: 34- 916931259; E-mail: mdigioia@intramed.net.ar
Received Date: 02 July 2014
Accepted Date: 05 August 2014
Published Date: 08 August 2014
Citation
Di-Gioia MC, Gallar P, Cobo G, García-López F, Aparicio JLA, et al. (2014) Body Composition Changes in Hemodialysis Patients: Implications for Prognosis. Enliven: Nephrol Renal Stud 1(1): 001.
Copyright
@ 2014 Dr. María Cristina Di Gioia. This is an Open Access article published and distributed under the terms of the Creative Commons Attribution License, which permits unrestricted use, distribution and reproduction in any medium, provided the original author and source are credited.
Abstract
Background: Overhydration, inflammation and protein-energy wasting have been related to all-cause mortality in dialysis patients, being lean mass loss, a poor prognostic factor.
Objective: to monitor body composition changes (BCC) in hemodialysis (HD) patients and to relate BCC to mortality. Methods: Prospective follow up
study: Bioimpedance spectroscopy (BIS) and nutritional parameters were performed every 6 months during three years.
Results : Overall data show a significant loss of weight at 12m, 24m, and 36m, with decrease of lean tissue index and phase angle (PA) in each period
measured. Fat tissue index (FTI) diminished in the third year’s measurements. End of first year, 41 % of patients gain weight, them at baseline had lower
age, higher serum albumin, lower Extracelular/intracellular water index (ECW/ICW) and higher PA, showing a significant FTI increase. Higher baseline
PA was gain weight predictor by binary logistic regression. Cox regression analyses: Age, diabetes, HD technique, albumin, ECW/ICW, and PA were
mortality predictors in univariate analysis; being PA the main mortality predictor in multivariate analysis. BCC were not associated with mortality. ROC
curve: PA higher than 4.85° is protective for mortality.
Conclusions: Lean mass loss was the most important change during follow up; we have not observed association between BCC with mortality. PA was
the main mortality predictor.
Keywords
Body composition, Bioimpedance spectroscopy, Hemodialysis, Mortality
Introduction
Hemodialysis (HD) patients suffer high cardiovascular mortality. In addition to age and comorbidity; overhydration, inflammation and protein-energy wasting (PEW) have been related to all cause of mortality in chronic kidney disease (CKD) patients. PEW is the state of decreased body stores of protein and energy fuels [1- 2].
Diverse studies have shown that both, body fat mass and lean mass were independent predictors of outcomes in hemodialysis patient?s cohorts [3]. Additionaly, these studies exposed that in dialysis patients the loss of lean mass, especially muscular mass is a poor prognostic factor [3,4]. Besides that an accurate assessment of lean body mass is difficult; measurements of serum creatinine, mid-arm muscle circumference [5] and, more recently, bioelectrical impedance analysis represent valid options.
Bioimpedance spectroscopy (BIS), estimates lean mass, which mainly reflects muscular mass [6-7]. Compared favorably with dilution methods, it has been validated in HD population [9] and offers the possibility of evaluating body composition and hydration state [8-10]. The Phase angle (PA), measurement obtained by bioimpedance, is calculated as the arctangent of reactance over resistance at frequency 50 kHz and is related to body cell mass and to the distribution of fluid between intracellular and extracellular compartments [11]. Furthermore, it has a good correlation with nutritional parameters and is a good marker of survival in dialysis patients [12].
In a previous study, our group did not find any significant body composition changes during a period of six months [13]. In this sense, our primary goal was to look if body composition changes occur over longer periods of time in HD patients; and in addition to observe whether it changes could be related to survival in our cohort.
Methods
We performed a prospective follow-up study including 110 HD patients. Just patients that were more than two months in the technique in stable condition and without hospital admissions during the previous two months were included. Every 6 months BIS and nutritional parameters were assessed. Patients in which BIS was contraindicated were excluded: implanted electronic device, metallic prostheses of any type, amputated patients, pregnant or lactating women.
Patients were 18 years old or above and had signed an informed consent approved by the Institutional Ethics Committee of Severo Ochoa Hospital.
Cardiovascular disease was defined as the presence of heart failure, coronary artery disease and peripheral vascular disease. Dry weight was assessed by clinical criteria and was adjusted immediately after each dialysis treatment.
Blood samples and BIS were obtained in the same day, before the second dialysis treatment of the week and after 20 minutes in semi-recumbent position. Biochemical parameters of nutritional status included serum creatinine and serum albumin (ALB). C-reactive protein (CRP) was a measure of inflammation. All were analyzed according to certified methods in the Biochemistry Department of the Hospital Severo Ochoa.
Bioimpedance was assessed with Body Composition Monitor (BCM, Fresenius Medical Care, Deutschland GmbH). Patients were measured and weighted in pyjamas. Following measures were taken: extracellular water (ECW), intracellular water (ICW) total body water (TBW) in liters, lean tissue index (LTI) defined as the quotient of LTM/ height² (kg/m²), fat tissue index (FTI) defined as the quotient of FAT/ height² (kg/m²].), ECW/ICW ratio, body cell mass (BCM) in kg, and PA in grades.
Statistical Analysis
All analyses were performed using SPSS version 12 (SPSS Inc, Chicago, IL, USA). Normally distributed variables are shown as mean ±SD and not normally distributed variables as median plus interquartile range (25-75) (IQR).
Categorical variables are shown as number and percentage. Comparison among groups was performed using Student?s t test for paired and independent measures in quantitative and ?2 in qualitative variables. CRP values were normalized for study by the transformation in natural logarithm. To evaluate the influence of several variables as predictors of weight gain in the first year, we used binary logistic regression.
Survival analyses were performed using cumulative incidence estimates in the presence of renal transplantation as a competing risk. Simple and multiple Cox regression analyses were used to assess the influence of different variables on mortality [14]. For multivariate analysis, all variables showing statistically significant relation with mortality were included, as well as clinically significant variables, even if they didn?t achieve statistical significance. A P value < .05 was considered significant. ROC (receiver operating characteristic) curve to determine the sensitivity and specificity of phase angle for prediction of mortality was used. Precision estimates were computed using 95% confidence interval.
Results
| VARIABLE | (n=110) |
|
Age(years) |
59±15 |
|
Male gender n (%) |
71 (64 %) |
|
Dialysis vintage (days) |
682(250-1011) |
|
Diabetes n (%) |
36 (32.7%) |
|
Cardiovascular disease n (%) |
39 (35.5%) |
|
Conventional Hemodialysis n (%) |
83 (76 %) |
|
On- line Hemodiafiltration n (%) |
27(24%) |
|
Weight (kg) |
68 ± 13 |
|
BMI (Kg/m2) |
26±4.82 |
|
Creatinine (mg/dL) |
7.97 ±2.39 |
|
Albumin (g/dL) |
3.79 ± 0.39 |
|
CRP log n |
1,8±1,21 |
|
LTI (Kg/m2) |
12,1 ±2,8 |
|
FTI (Kg/m2) |
13,3± 5,9 |
|
BCM (kg) |
17 ±6.09 |
|
TBW (L) |
31 ±5.71 |
|
ECW (L) |
15 ± 3.00 |
|
ICW (L) |
18± 3.44 |
|
ECW/ICW |
0.94 ± 0.14 |
|
Phase angle (º) |
4.67 ± 1.00 |
Table 1 shows clinical, biochemical and BIS characteristics at baseline. Mean follow-up was 22 (IQR 8 to 34) months. During the study 23 patients (21%) died, 30 (27%) received transplantation, 3 (3%) were transferred to other facilities and 53 (49%) remained in study. Therefore, of the 110 patients, 68 completed one year, 47 two year and 39 three year follow-up.
Data are shown as mean ± SD, percentage or median and range. Abbreviations; BMI= Body mass index; CRP= C-reactive protein log n; LTI = Lean Tissue index; FTI= Fat Tissue index; BCM = body cell mass; TBW= total body water. ECW= Extracellular water; ICW= Intracellular water; ECW/ICW = Extracelular water / Intracelular water index.
Throughout the study period, in whole sample, the patients suffered overall significant loss of weight, lean body mass (LTI, ICW, and BCM) and total body water from the first year to the last observation accompanied by decreasing PA. Fat mass (FTI) diminished slowly only after the third year?s measurements. ALB increased significantly in the first year in parallel with the significant decrease in ECW without changes during the rest of follow up (Table 2).
| Variable | 12 months | 12 months | P | 24 months | 24 months | P | 36 months | 36 months | P |
|
|
n:68 |
n:68 |
|
n:47 |
n:47 |
|
n:39 |
n:39 |
|
|
Age (years) |
60±16 |
|
|
|
|
|
|
|
|
|
Gender (male) |
65% (71) |
|
|
|
|
|
|
|
|
|
Dialysis vintage (months) |
43±65 |
|
|
|
|
|
|
|
|
|
Diabetes Mellitus |
33% (36) |
|
|
|
|
|
|
|
|
|
CVD |
36 % (39) |
|
|
|
|
|
|
|
|
|
Weight (kg) |
67,42±13 |
66,2±13,6 |
.011 |
68,22±12,03 |
65.98±12,03 |
.00 |
66,62±11,93 |
64,12±11,83 |
.004 |
|
BMI (Kg/m²) |
25,54±4,85 |
25,07±4,88 |
.017 |
26,01±4,52 |
25,14±4,29 |
25,14± |
25,10±3,39 |
23,93±3,49 |
.014 |
|
Creatinine (mg/dL) |
8,21±2,32 |
8,35±2,53 |
.548 |
8,40±2,17 |
8,42±2,46 |
.947 |
9,05±1,53 |
8,27±2,59 |
.061 |
|
Albumin (g/dL) |
3.82 ± 0.34 |
3.96 ± 0.37 |
.002 |
3,80±0,31 |
3.79±.0,51 |
.843 |
3,76±0,31 |
3.74±.39 |
.691 |
|
CRP Log n |
1,87 ± 1,23 |
1.78±1.11 |
.463 |
2,09±1,18 |
2,01±1,41 |
.674 |
1,94±1,09 |
2,14±1,05 |
.408 |
|
LTI Kg/m² |
12,1 ± 2,8 |
11.62±2.53 |
.013 |
11,93±2,66 |
11.41±2.53 |
.06 |
11,81±2,52 |
10.86±2.91 |
.044 |
|
FTI Kg/m² |
12,70±6,09 |
12,88±6,09 |
.517 |
12,97±5,37 |
12,54±4,71 |
.22 |
13,15±5,50 |
12.07±4.5 |
.017 |
|
BCM (Kg) |
17,61 ± 5,9 |
16,18 ±5.47 |
.001 |
17,00±5,97 |
15,90±5,59 |
.04 |
16,86±5,87 |
15.06±6.5 |
.05 |
|
TBW (L) |
31.75 ± 5,27 |
30,36±5,10 |
.000 |
31,35±5,38 |
30,45±5,51 |
.02 |
31,35±5,65 |
29.75±6.32 |
.02 |
|
ECW (L) |
15.2 4±2.42 |
14.78 ± 2.32 |
.003 |
15,16±2,51 |
14,93±2,60 |
.24 |
14,93±2,50 |
14.98±2.53 |
.854 |
|
ICW (L) |
16.51±3.34 |
15.74±3,08 |
.000 |
16,20±3,35 |
15,51±3,26 |
.009 |
16,10±3,97 |
15.05±3.97 |
.021 |
|
ECW/ICW |
0,94± 0,14 |
1,1±1,06 |
.286 |
0,95±,14 |
,97±,13 |
.14 |
0,95±0,13 |
0,98±0,14 |
.119 |
|
Phase angle (º) |
4,72±0,92 |
4,52±0,92 |
.021 |
4,70±0,83 |
4,30 ± 0,92 |
.001 |
4,69±0,84 |
4,14±1 |
.000 |
Table 2. Course of body composition parameters and serum chemistries
Data are shown as mean ± SD. Parameters with significant variation from baseline value through the follow-up are show. Abbreviations: BMI: Body mass index; CRP Log n: Natural logarithm C-reactive protein: LTI: Lean tissue index; ; FTI =fat mass index ; BCM= body cell mass; TBW = total body water; ECW = extracellular water; ICW = intracellular water.
Depending on the modifications of body weight during the first year of follow-up the patients were classified according to weight gain (>0kg/) or loss (? 0kg). By the end of the first year of follow up (with 68 patients), 28 (41%) gained weight and 40 (59%) lose it. Patients gaining weight, at baseline, had lower age (p: 0.05), higher ALB (p: 0.05), lower ECW/ICW (p: 0.001) and higher PA (P=.005). There were no significant differences according to dialysis technique (P=.508) or in patients with overweight at baseline (P=.744). Dialysis vintage did not influence weight gain in the first year. When baseline PA was lower than the median (4.60º (IQR 3.80-5.45) 35 percent of patients lose weight, while only 9% experienced weight reduction if PA was >4.60º (P=.027). Nevertheless, in those patients gaining weight, a significant increase of FTI (P< .001) was found, without significant variations on LTI and PA. ECW diminished in both groups, but more so in weight losers (P=.011) (Table 3).
| Patients gaining weight (n= 28) | Patients losing weight (n=40) | P | |
|
Age (years) |
56±14 |
63±14 |
0.052 |
|
Gender male (n %) |
18 (58%) |
28 (79 %) |
0.09 |
|
Diabetes (n %) |
26 (79 %) |
26 (72 %) |
0.534 |
|
CVD (n %) |
12 (38%) |
17 (47%) |
.426 |
|
Creatinine (mg/dL) |
8,4± 2,3 |
8,0± 2,3 |
0.442 |
|
Albumin (g/dL) |
3,9±0,2 |
3,7±0,4 |
0.05 |
|
Log n CRP |
2,0±1,3 |
1,8±1,2 |
0.466 |
|
BMI Kg/m2 |
26±6 |
25±4 |
0.791 |
|
LTI Kg/m2 |
12,8±2,5 |
11,7 ± 2,8 |
,095 |
|
FTI Kg/m2 |
12 ,6± 7,0 |
12,8 ± 5,3 |
,860 |
|
ECW/ICW |
0.88 ± 0,12 |
0.99 ± 0.14 |
0.001 |
|
Phase angle (°) |
5.1 ± 0.8 |
4.4 ± 0.9 |
0.005 |
|
? LTI Kg/m2 |
-0,71±2,25 |
-0,51±1,83 |
0.743 |
|
? FTI Kg/m2 |
1,42± 1,96 |
- 0,96±1,93 |
< 0.001 |
|
? ECW (L) |
-.09±1 .06 |
-.89±1.17 |
0.011 |
|
? Phase angle (º) |
-0,20±0,65 |
-0,19±0,60 |
0.966 |
Data are shown as mean ± SD. Abbreviations: CVD: Cardiovascular disease; Log n CRP: Natural logarithm C-reactive protein; BMI: Body mass index; LTI: Lean tissue index: FTI: Fat tissue index; ECW/ICW = Extracellular r/intracellular water ratio.
? = Variation.
To evaluate the influence of several variables as predictors of weight gain in the first year, a logistic regression was done. Only FTI and ECW/ICW showed a predictive value in univariate analysis. In multivariate analysis, we also introduced PA because of its clinical relevance. In this model, higher baseline PA was predictor de weight gain in the first year (Table 4).
| Variable | Univariante Odds Ratio (95 CI%) | P | Multivariante odds Ratio (95%cl) | p |
|
Age (years) |
1,26(,983-1,528) |
0.07 |
|
|
|
Gender |
, 415 (,005-34,434) |
0.697 |
|
|
|
Diabetes |
6, 572 (0,66-658,38) |
0.423 |
|
|
|
CVD |
1, 915 (, 051-71, 545) |
0.725 |
|
|
|
Albumin (g/dL) |
47,78 (,075- 30377,95) |
0.24 |
|
|
|
LTI |
,164 (.022-1,209) |
0.076 |
|
|
|
FTI |
4,279 (1.13-16,154) |
0.032 |
|
|
|
ECW/ICW |
6,23 (4.66-83.247) |
0.01 |
|
|
|
Phase angle (º) |
1,711(.05-58,998) |
0.766 |
3,877 (1,398-10,751) |
0.009 |
Table 4: Univariate and multivariate logistic regression: predictors of weight gain in the first year Abbreviations: CVD: Cardiovascular disease; LTI= Lean Tissue index; FTI = Fat Tissue Index; ECW/ICW = Extracellular/Intracellular water ratio;
Survival Analysis
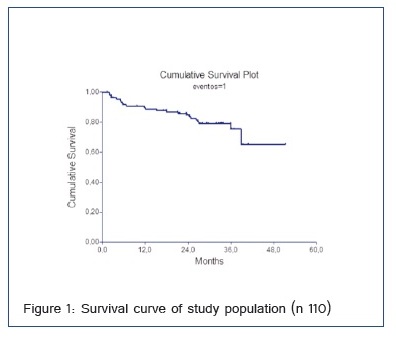
Survival was 88% in the first year, 76% in the second and 62% in the third year of follow-up (Figure 1).
Uni- and multivariate Cox regression analysis: putative predictors of mortality: We introduce the variables listed at Table 5. Parameters related to mortality were: age, diabetes, HD technique (OL-HDF), ALB, ECW/ICW and PA (Table 5).BCC were unrelated to survival all over the study period. In multivariate analysis, for each increase of 1 degree in the PA, mortality risk diminished by 67% (hazard ratio: 0.33; 95% CI: 0.14-0.78) (Table 5).
| Univariate analysis | Multivariate analysis | ||
| Hazard Ratio (95% CI) | P | Hazard Ratio (95% CI) | |
|
Age |
1.06(1.022-1.099) |
0.002 |
|
|
Sex (males) |
0.736(0.313-1.730) |
0.482 |
|
|
Diabetes |
0.360(0.149-0.870) |
0.023 |
|
|
CVD |
0.935(0.424-2.063) |
0.867 |
|
|
Dialysis vintage (months) |
1.000 (0.993-1.006) |
0.926 |
|
|
Hemodialysis technique |
0.220 (0.051-0.946) |
0.042 |
|
|
Creatinine (mg/dL) |
0.860(0.661-1.118) |
0.26 |
|
|
Albumine (g/dL) |
0.224(0.083-0.601) |
0.003 |
|
|
PCR Log n |
1.465 (0.650-3.300) |
1.465 |
|
|
BMI (Kg/m2) |
1.051 (0.962-1.147) |
0.269 |
|
|
LTI (Kg/m2) |
0.848 (0.709-1.014) |
0.071 |
|
|
FTI (Kg/m2) |
1.066(0.988-1.150) |
0.1 |
|
|
ECW/ICW |
18.708(0.985-35.5) |
0.051 |
|
|
Phase angle º |
0.414(0.220-0.778) |
0.006 |
0.337 (0.144-0.788) |
|
? LTI one year |
0.919 (0.610-1.385) |
0.686 |
|
|
? FTI one year |
1.053 (0.0798-1.391) |
0.713 |
|
|
? LTI Two years |
1.132(0.704-1.822) |
0.609 |
|
|
? FTI two years |
0.880 (0.620-1.250) |
0.475 |
|
Table 5: Uni- and multivariate Cox regression analysis of possible mortality predictors
Abbreviations: CVD: Cardiovascular disease; Log n CRP: Natural logarithm C-reactive protein; BMI = Body mass index; LTI= Lean Tissue index; FTI = Fat Tissue Index; ECW/ICW = Extracellular/Intracellular water ratio. ?: Variation.
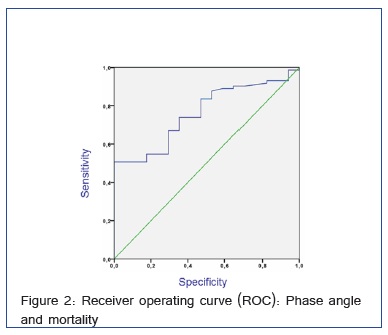
ROC Curve between Phase Angle and Mortality
The survival predictive utility of PA was calculated by ROC curve, with the area under the curve of 0.762, 95% CI (0.655 to 0.869). For a PA greater than 4.85º we obtain a sensitivity of survival of 50% and a specificity of 100%. A PA larger than 4.85° is a protective factor for mortality 0.679 (0.564 to 0.816) (Figure 2).
Discussion
This observational study shows longitudinal changes in body composition measured by BIS during three years in HD patients. In our previous data, patients on HD have no discernible changes during 6 months [13].
The loss of lean mass was the most important change in the present study. In patients with CKD, muscle wasting is common and studies of animal models of CKD and other catabolic conditions indicate that impaired insulin/IGF-I intracellular signaling stimulates protein degradation in muscle[15].. It has been described that patients with diabetes suffer an accelerated loss of lean body mass in incident dialysis treatment In our series, LTI loss was not higher in patients with diabetes or patients with cardiovascular disease; nevertheless, our cases were predominantly prevalent, so that, there may be differences with incidents. Recently, the progressive loss of lean mass has been shown to be an independent risk factor for mortality in these patients [17], therefore some useful tools for its monitoring should be included in the clinical practice. In this sense, it has been suggested that the loss of muscle mass measured by bioimpedance was more relevant than mid arm muscle circumference for identifying patients with higher protein catabolism and risk of mortality [17].
On the other hand, in order to avoid or delay the loss of lean mass some strategies should be trying. Regarding this, exercise training could have a potentially benefit, especially considering the high rate of inactivity reported in this group.[18] However, more information is needed to optimize exercise regimens [18].
In addition to lean mass changes, a high percentage of patients gained weight during the first year of follow up, and do so through an increase of fat mass, similar results were found in a study of frequent hemodialysis.[19]. Besides that, this group had a better baseline condition (lower age, higher PA, albumin and lesser degrees of overhydration), the fact that PA (which is a measure of muscle mass and hydration status) was the strongest predictor of weight gain in multivariate analysis could be interpreted like that patients with better muscle mass and who are less overhydrated are less likely to get into a state of wasting typical of CKD. This result validates our experience that reaching a dry weight is important to achieve an adequate nutritional status [20]. Perhaps only the scheduled exercise may modify the inexorable loss of muscle mass observed in these patients. Others authors have found that, fat-loss groups had an increase in the death risk even after extensive multivariate adjustment.[21]. In another studies, a trend between higher peripheral fat mass and lower mortality was found, whereas higher muscle mass exhibited the greatest survival [22]. Another study including incident patients seem to point to a protective effect of overweight at the beginning of HD [23], whether an increase in adiposity in patients on hemodialysis is beneficial or harmful is unknown; however large observational data suggest that a considerable proportion of the obesity paradox in dialysis patients might be explained by the amount of decline in muscle mass [24].
Another important and interesting finding in our study is the relevance of phase angle at baseline as a prognostic factor. No patient with a PA higher than 5º died during follow-up in our sample. It has been observed a good correlation between PA (actually, a measure of BCM) and survival, although it is unclear whether this correlation is indeed linked with the nutritional status[12].. Some authors have found that patients with the lowest PA had a 1.5 higher relative risk of mortality, independent of age, gender, race, diabetes, serum albumin and serum creatinine [12]. In Spain, similar results were shown in HD by Abad et al. [25] and in predialysis by Caravaca et al.[26] According to our own data a PA higher 4.85º in hemodialysis seems enough to point out a good survival prognosis in these patients And our results support the realization of some kind of intervention when PA decreases below 4.85 ° or muscle loss is detected.
At variance with other studies [2], we did not find an association of BIS measurement related to volume and short term survival, but this could be explained by the fact that dry weight is assessed and reassessed in each HD session. The demonstration of the regression of left ventricular mass index with strict fluid and dry weight control with the help of BIS [27] may suggest a possible impact of these parameters on survival in other cohorts.
The importance of serial BIS measurements stems from the fact that in the stable patient, BCC, especially in lean and fat mass, are slow. In longer term we have not observed association between BCC and mortality perhaps because of probably few data and short follow-up.
This study has several limitations. It is a single center study, which could limit external validity. Since it is an observational study, no clear causal relationships can be established, statistical associations don?t mean causality. There may have been confounding factors in the associations. Finally, the limited follow-up may have clouded weak associations.
Conclusion
In this study the most important change in body composition during three years of follow up was lean mass loss, being this similar in patients who gain or lose weight. We could not demonstrate association of BCC with mortality. On BIS analysis, PA higher than 4.85º is protective for mortality. Repeated BIS measurements may help to detect changes in body composition, which could lead to some kind of intervention.
Acknowledgments
Emilia Condes. Servicio de Epidemiología, Universidad Europea de Madrid e Isabel Millan, Sección de Bioestadistica Hospital Puerta de Hierro, Madrid.
Conflict of interest statement
The authors declare no conflicts of interest.
Disclosure of grants or other finding
The authors declare they have not received grants or other funding sources.